
Two years in, the 2022 to 2024 vintages have used most of their loss cushion. The sponsor’s own forecast is in the prospectus, and so is the servicer data to check it against. We did, for 157 deals. Here is what it means for anyone holding or financing auto paper, and why this is a job for a data platform rather than an analyst with a spreadsheet.
When an auto lender sells an ABS deal and keeps the first-loss piece, it has to tell you, in the prospectus, how much it expects the pool to lose over its life. Almost nobody reads that number. We pulled it from about 250 registered deals (most state it in a sentence, some as a month-by-month table), matched it to the servicer reports for the 157 that are about two years old, and asked: are the pools losing what the sponsor said they would?
For the 2020 and 2021 vintages, the answer is no, by a wide margin. For everything issued since, the answer is getting closer to yes.
The 2022 to 2024 vintages are tracking close to the sponsor’s curve
Auto losses are front-loaded, so comparing a two-year-old pool to a lifetime forecast needs a timing curve. Most sponsors disclose their own next to the loss assumption, and we use it: GM Financial and Ford expect about 70% of lifetime losses by month 24, Hyundai, Volkswagen, AmeriCredit, CarMax and Nissan 60 to 69%, BMW 80%, Exeter about 52%. Santander and Bridgecrest say their curve follows the shape of their past securitizations without giving numbers, so for those three shelves we use the share their own seasoned pools show at month 24 (73 to 78%). The result is a tracking ratio: 1.0 means the pool is exactly on the sponsor’s curve, 0.5 means it has used half the loss budget it should have used by now.
By vintage (prime / subprime; the twelve vintage-by-tier cells are uneven in size, holding between 8 and 17 deals each and 157 in total): 2019, 0.64 / 0.42; 2020, 0.25 / 0.24; 2021, 0.46 / 0.40; 2022, 0.51 / 0.69; 2023, 0.81 / 0.67; 2024, 0.96 / 0.70.
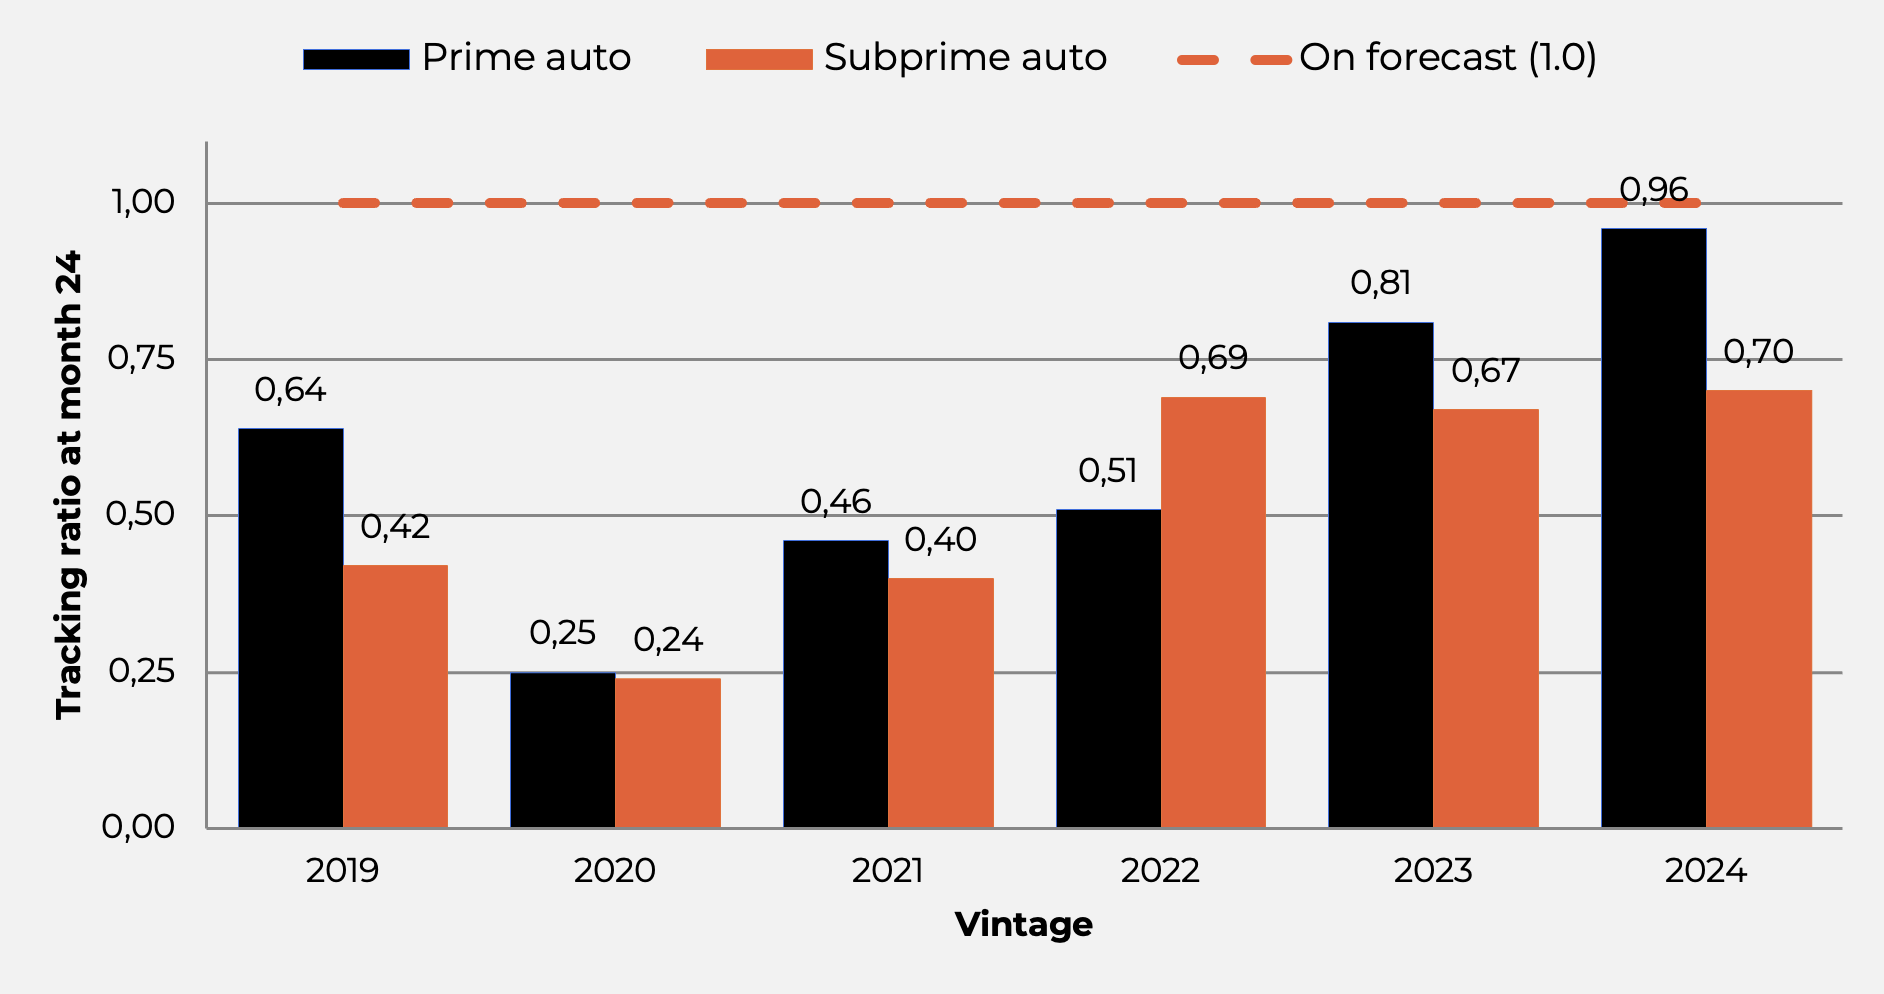
Figure 1. Tracking ratio by vintage: realized loss at about month 24 as a share of the loss the sponsor’s own curve implied by then. 1.0 is on forecast.
The 2020 and 2021 pools, written into stimulus-era consumer balance sheets, are the outliers. Prime has climbed every year since and the 2024 pools are almost exactly on their sponsors’ curves (0.87 with CarMax taken out). Subprime jumped in 2022 and has sat near 0.7 since; if the three Santander and Bridgecrest shelves are put on AmeriCredit’s 60% curve instead of their own observed shape, subprime reads about 0.85. The 2024 cohort has 22 to 24 months of history (17 prime, 13 subprime deals), so treat that point as provisional.
None of this is a breach. None of the sampled servicer reports flags a delinquency trigger event, these shelves carry no cumulative-loss trigger that the report tests, and sponsors set these assumptions with a cushion. But the cushion is mostly spent on the recent vintages, and a cushion that is spent is not a cushion.
Which shelves are ahead of their own forecast
The cushion is shelf-specific. Across all 157 deals the median ratio is 0.56, and 15% of deals are above 1.0. Table 1 shows the twelve shelves with more than one deal in the sample, which together account for 156 of the 157; the remaining deal is the single CarMax Select pool (CMXS 2024-A), which is included in every sample-wide and vintage figure but is not shown as a one-deal row.
Table 1. Sponsor forecast versus realized loss, by shelf
| Shelf | Deals | Median assumption | Median realized at ~24m | Share by month 24 | Tracking ratio |
|---|---|---|---|---|---|
| Volkswagen (VALET) | 4 | 1.25% | 0.99% | 60% | 1.27 |
| CarMax (CARMX) | 24 | 2.25% | 1.31% | 69% | 0.97 |
| Hyundai (HART) | 12 | 1.50% | 0.76% | 60% | 0.83 |
| Ford (FORDO) | 14 | 0.91% | 0.39% | 71% | 0.58 |
| Nissan (NAROT) | 12 | 1.14% | 0.33% | 68% | 0.44 |
| GM Financial (GMCAR) | 23 | 1.20% | 0.35% | 70% | 0.42 |
| BMW (BMWOT) | 5 | 0.90% | 0.07% | 80% | 0.10 |
| Bridgecrest (BLAST) | 5 | 27.5% | 18.6% | 73% | 0.93 |
| Exeter (EART) | 4 | 22.5% | 8.4% | 52% | 0.72 |
| Santander Drive (SDART) | 28 | 16.0% | 7.2% | 73% | 0.61 |
| AmeriCredit (AMCAR) | 14 | 11.0% | 2.8% | 60% | 0.43 |
| Drive (DRIVE) | 11 | 25.0% | 8.3% | 78% | 0.41 |
CarMax’s 2022 to 2024 pools (1.2 to 1.4) and Volkswagen’s 2023 and 2024 pools (2.4 and 1.5) are above their sponsors’ own curves. Hyundai’s and Ford’s 2023 and 2024 pools are on them (0.9 to 1.0), as are Bridgecrest’s (1.0 and 0.9). GM Financial and AmeriCredit look comfortable over the full sample (0.42 and 0.43), but their 2023 and 2024 pools are at 0.5 to 0.6 and 0.75 to 0.9.
What this means if you hold or finance auto paper
Start with a stylized subprime deal built like a 2024 Santander Drive transaction: 16% lifetime loss expected, 70% of it by month 24, so 11.2% at two years. At closing the senior notes sat behind 43 points of protection[1] and the BBB class behind 10. Table 2 shows three outcomes.
[1] The rated classes below them plus 9 points of overcollateralization, meaning loans in excess of notes
Table 2. One subprime deal, three outcomes at month 24
| Inside forecast | On forecast | Ahead of forecast | |
|---|---|---|---|
| Realized loss at month 24 | 5.6% | 11.2% | 14.6% |
| Tracking ratio | 0.5 | 1.0 | 1.3 |
| Lifetime loss at this pace | 8% | 16% | 21% |
| Against the sponsor’s 16% | 8 points of cushion left | Cushion used, as planned | 5 points over |
| What it means | Twice the designed protection; bonds de-risk faster | As the prospectus said | Excess spread and OC absorbing unmodelled losses; BBB margin gone |
If you own the mezzanine or the residual. Your protection was sized to the sponsor’s number. In the third column nothing is breached, but the cushion goes faster than planned, as in CarMax’s and Volkswagen’s 2022 to 2024 pools today. Ask the sponsor not “are you inside your triggers” but “are you inside your own forecast”.
If you own the senior notes. The 2020 and 2021 pools sit in the first column, twice as protected as designed, where the value in seasoned paper lies. The 2024 pools sit in the second with two years to run; months 30 and 36 are the dates to check.
If you lend to the auto lender rather than buy its bonds. For a warehouse or forward-flow facility, the lender’s public deals are the best evidence that its loss forecasts hold. If they run at 1.3 times its own number, set the loss covenant and advance rate on realized performance, not on the lender’s model. The prospectus forecast is the lender’s own public figure, a fair anchor for that conversation.
Reading the protection. Senior protection at closing over the sponsor’s number is the coverage multiple: 3.1x to 5.5x in prime, 2.1x to 3.1x in subprime.[1] It belongs to the shelf, not the deal, so compare within tier and read it with the tracking ratio (Figure 2): at a ratio of 1.3, lifetime losses at this pace use 62% of senior protection on a 2.1x shelf, 42% on 3.1x and 25% on 5.1x. The same ratio is comfortable for a prime captive and serious for a deep-subprime lender; the multiple tells them apart.
[1] These are not the rating agencies’ multiples, which use stressed losses. For captive shelves with yield-supplement overcollateralization the protection is measured on a smaller adjusted pool than the loss, so their multiples run 3 to 10% high (BMW nearer 2.8x, Mercedes 5.3x).
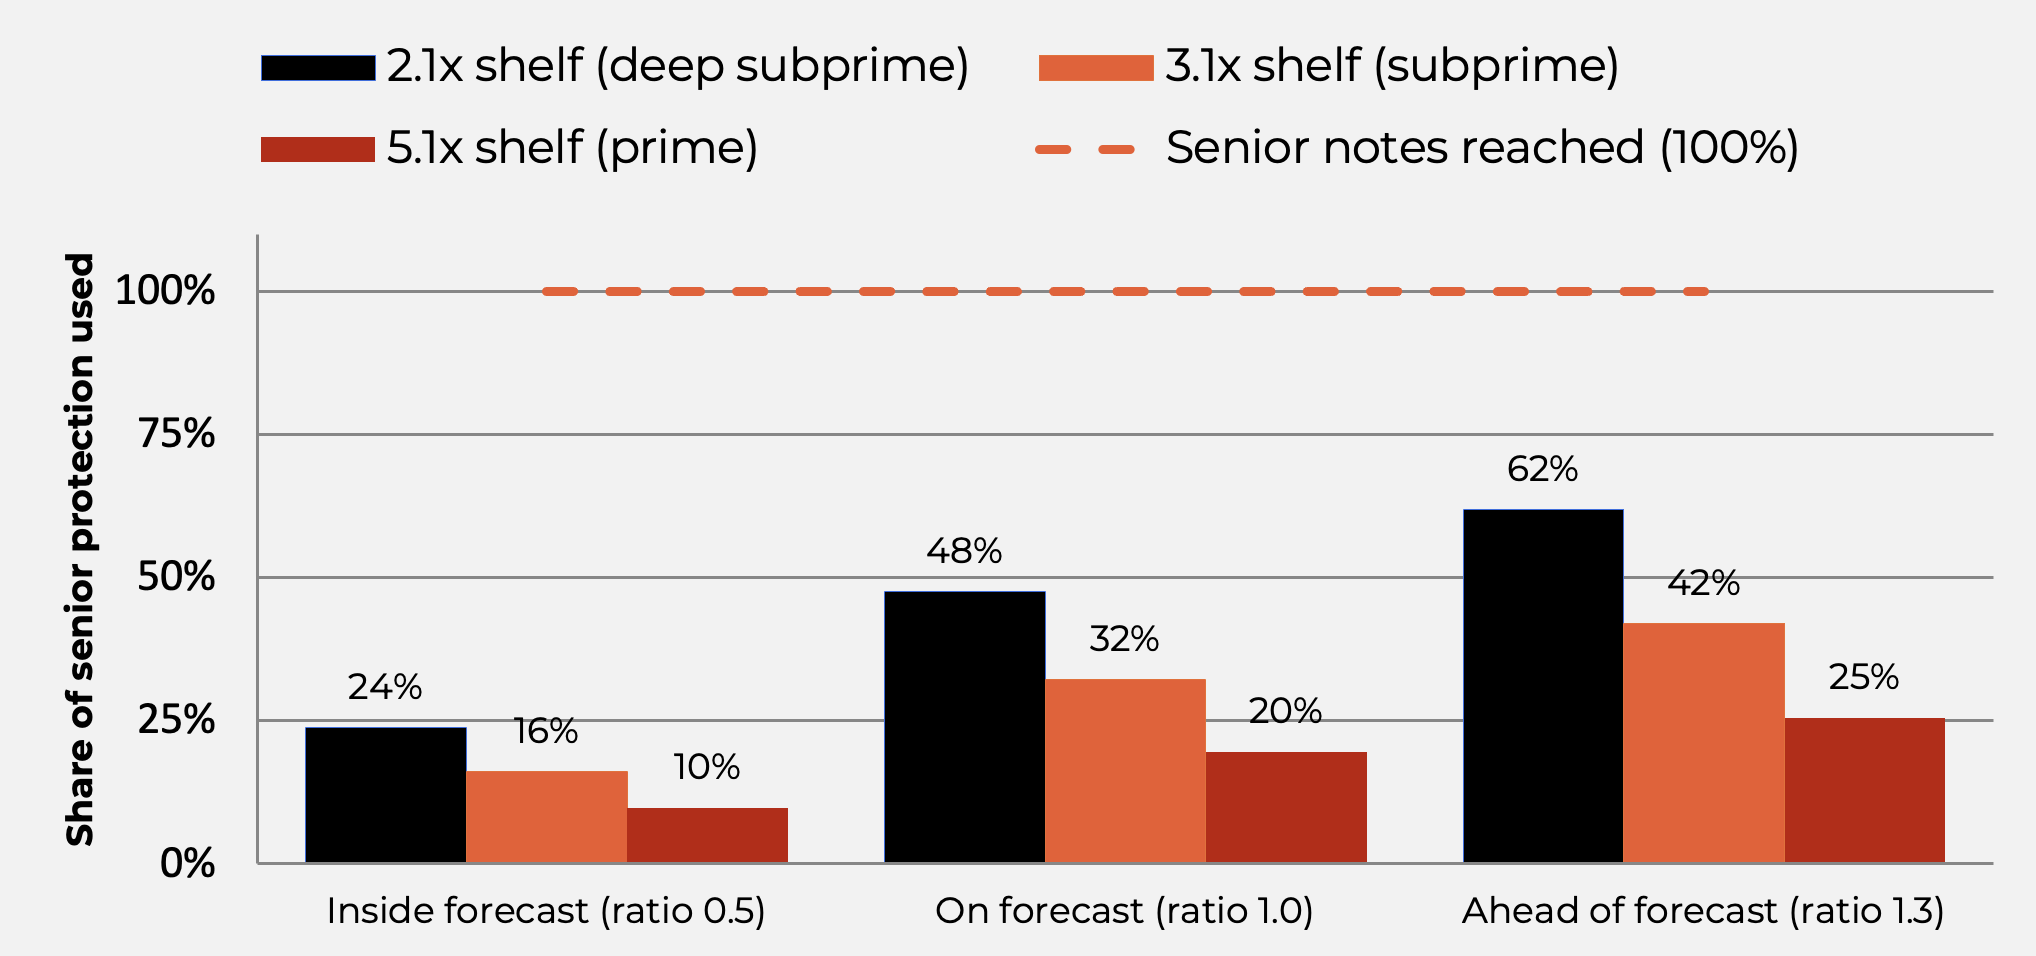
Figure 2. Share of senior protection at closing used by lifetime losses at this pace; excess spread excluded, so shares are conservative.
Why this needs a platform, not a spreadsheet
None of the analysis above is hard. The plumbing is. The assumption lives in 445 prospectuses in a dozen layouts; the realized losses live in servicer reports that each sponsor formats its own way; loss definitions differ at the margin; timing curves are disclosed by some sponsors and not others; and a vendor database will silently give you the wrong attachment point. We did this once, for one asset class, and the data work took an order of magnitude longer than the analysis. The traps are predictable. Two trusts from the same sponsor can share most of a name, so a filing is easily matched to the wrong deal. A sponsor’s disclosed timing curve sits in a table on a different page from its loss assumption, so it is easy to read one and miss the other. A reporting template changes without notice, and a parser that worked last quarter returns a number that is wrong this quarter. A purpose-built platform is designed around exactly these hazards: document-to-deal matching validated against the filing cover rather than a name, one parser per sponsor template maintained as templates change, and every field traceable back to the line in the filing it came from.
That is the case for doing it on a platform rather than in a spreadsheet: ingest every servicer report as it is filed, normalize the loss definition per sponsor, hold the sponsor’s assumption and curve against each deal, and recompute the tracking ratio for every position every month, with the vintage and shelf views above as standing reports. The same test applies to a private facility, where the GP receives a loan tape instead of a servicer report and the originator’s underwriting assumption plays the role of the prospectus number. Table 3 sets out what the ratio can trigger once it is on the screen every month.
Table 3. What the monthly ratio can trigger
| Tracking ratio | Senior holder | Mezzanine or residual holder | Facility lender |
|---|---|---|---|
| Below 0.7 | Hold; seasoned bonds are over-protected and candidates to add | Cushion intact; the subordinate bonds of these vintages are where secondary value sits | Room to improve terms at renewal: higher advance rate or tighter pricing |
| 0.7 to 1.0 | Hold; check again at month 30 and 36 | Watch excess spread and overcollateralization build each month; no action yet | Keep terms; verify monthly against the loan tape |
| Above 1.0 | No action unless protection is thin (below 2.5x) and the ratio keeps rising | Ask the sponsor to explain the gap; reduce or hedge; price the next deal from this shelf wider | Reset the loss covenant to realized losses; lower the advance rate; check step-in rights |
Investors who run that loop can see a shelf drifting above its own forecast at month 12, when it is a conversation, rather than at month 24, when it is a price. The difference between the two is not analytical skill. It is whether the data arrives clean, reconciled and on time, every month, for every position, and that is an infrastructure decision.
Sources
EDGAR (445 SEC-registered auto and equipment prospectuses, 2019 to 2026; 2,123 servicer reports sampled at six points per deal); Green Street’s ABS database for deal and tranche terms; DBRS Morningstar releases for 41 144A deals. Realized loss is cumulative net loss as a percentage of the initial pool balance from the servicer report closest to month 24. Extraction code, the deal-level sample and the independent audit trail are available on request.
Turn loss data into better investment decisions. Book a demo.